In both 2020 and 2021 the Junior Certificate was cancelled. Instead, many schools awarded grades to 3rd year students representing their learning achievements in each subject over their Junior cycle. Although there were no official national statistics on 3rd year results for 2020 or 2021, we were asked by a number of schools to provide an analysis of these 3rd year results. So we came up with the following approach which we then also offered to other schools.
There are some challenges in providing this comparison. Firstly, as there was no official Junior Certificate, there are no available national 3rd year results. So we need to come up with some proxy for what the national results would have looked like had the exams gone ahead as normal. Most years, this would have been straightforward. The Junior Certificate results are marked to a similar “bell curve” each year and so the distribution of grades each year is predictable. However, the Junior Certificate is in the midst of a reform, bringing in the following new grading system:
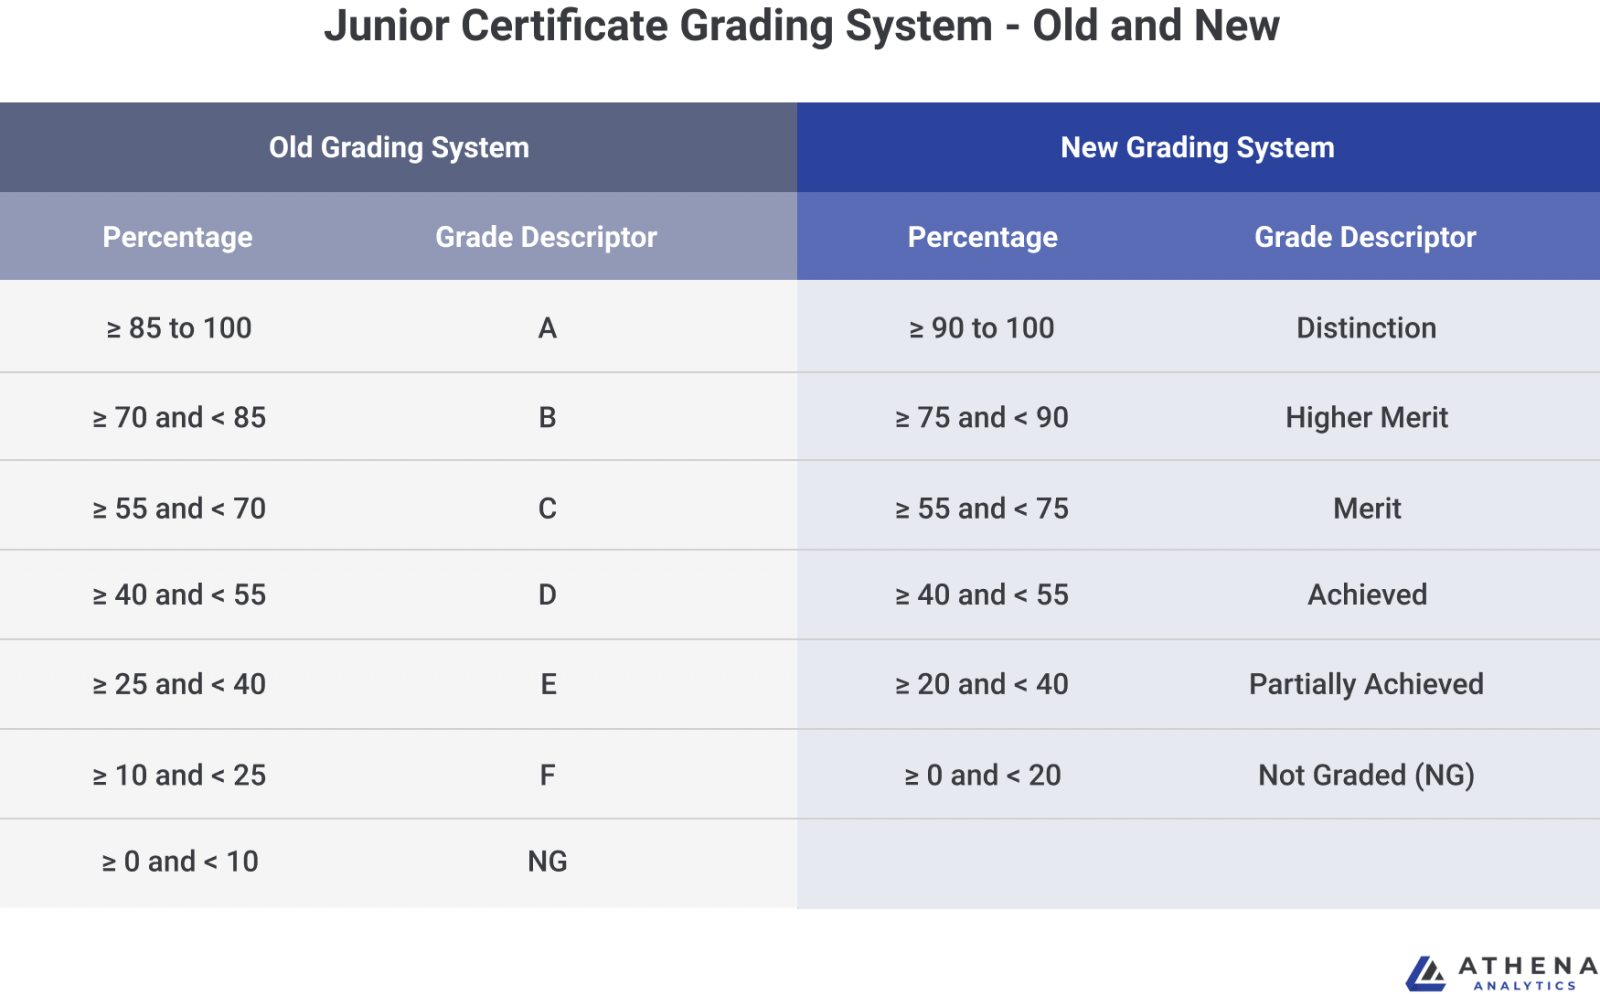
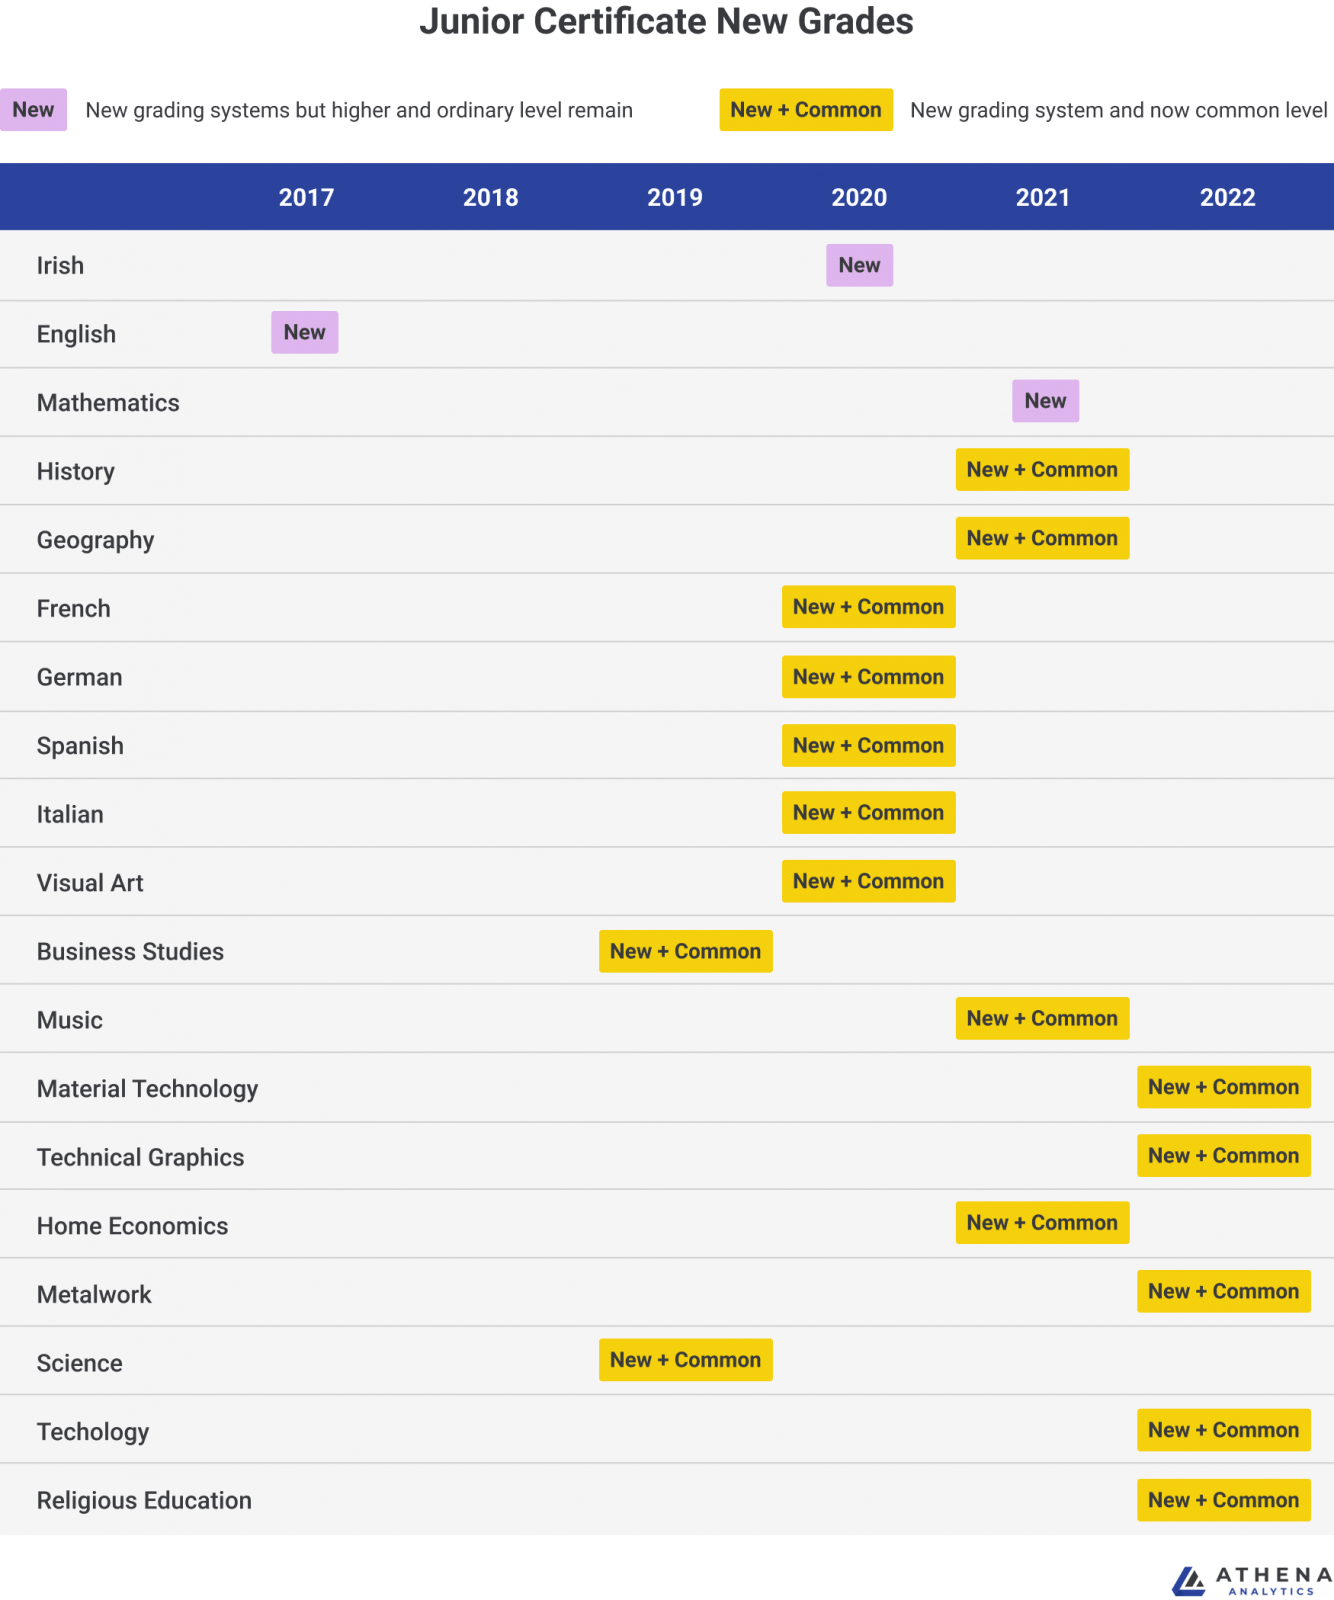
This brings two challenges. Firstly, there are new grades with new bands. The solution here could have been to take the previous distribution of grades from previous years and do some sort of mapping of old grades to new. The second issue is a bigger challenge. For all subjects except Irish, English and Mathematics; there is no longer a separation between Higher and Ordinary Level – almost all subjects are now common level. This makes it much more difficult to use the previous grading systems of these subjects. These changes have been brought in on a staggered basis, so each subject is at a different stage with this. Here is a table showing when these changes are applicable from.
The useful data we have available to “predict” what results might have been in a normal year is:
- The distribution of English results in 2017, 2018 and 2019 which used the new grading system at Higher and Ordinary Level
- The distribution of Science and Business Studies results in 2019 which used the new grading system at Common Level
- Previous distribution of results of Technology, Material Technology, Metalwork and Religious Education, which will not change to the new grading system until 2021/2022
- Previous distribution of results of all other subjects, which will need to mapped in some way to the new grading system.
Below is the approach we took. The purpose of these estimation was to come up with a reasonable benchmark for schools to compare their results to; it is not intended to be a prediction of high accuracy for what the results would have been had he exams gone ahead.
For English, Science, Business Studies, Technology, Material Technology, Metalwork and Religious Education we used the 2019 national results. These subjects have not changed in terms of grading system or level.
For Irish and Mathematics we compared the Irish/Mathematics distribution of grades with English distribution for 2014, 2015 and 2016. We then used this comparison to compare with English 2017, 2018 and 2019 results to come up with an estimate for what these results would look like using the new grading system.
French, German, Spanish, Italian and Visual Art (2020 and 2021) and History, Geography, Music and Home Economics (2021 only) have moved to the new grading system and have changed from having Higher and Ordinary Level to having Common Level only. We tried several different methods for mapping these subjects. We found that the simplest comparison was simply to use the average of the 2019 Science and Business Studies results distribution (adjusted to sum to 100%). If these subjects were still split into Higher and Ordinary Level we would have used the same method used for Irish and Mathematics. There are many limitations to this method which don’t allow for past differences in Business Studies and Science versus other subjects but we found it to be the best estimate, based on all available information.
Once we have these national estimates done, our reports are in the same format as previous years. Samples of these reports can be found here.
If you would like to sign up for an analysis of your 3rd year results, you can do so at this link.