
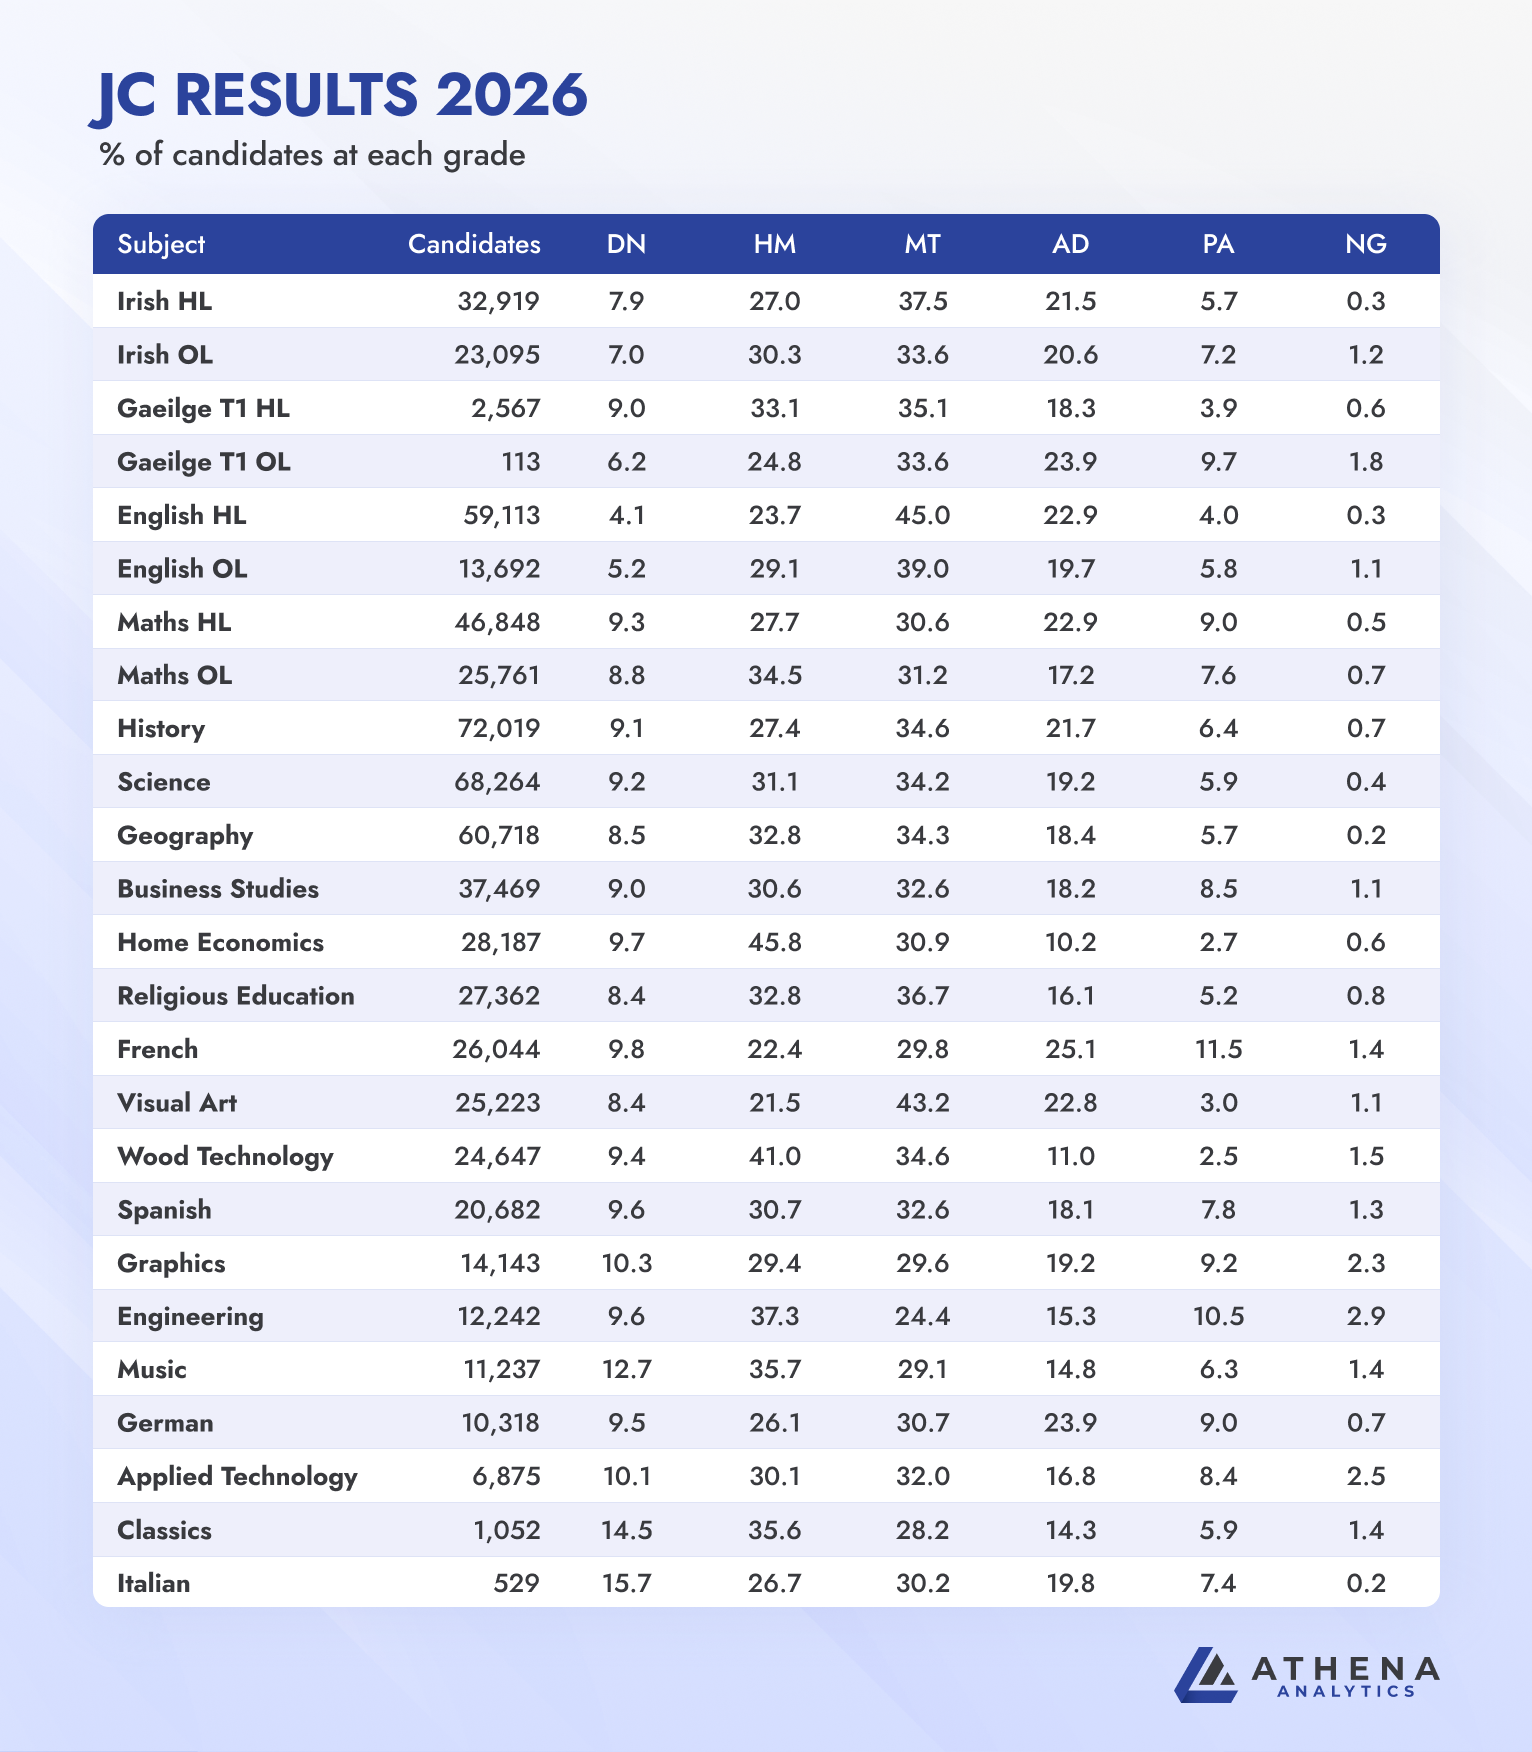
A record 73,879 candidates sat the 2026 Junior Cycle examinations, compared with 73,336 in 2025. The State Examinations Commission (SEC) issued 651,123 grades across 21 subjects.
The national figures provide a useful overview of this year’s results. However, looking at individual subjects reveals considerable differences in the proportions of candidates achieving the various grade categories.
From Italian and Classics to English, History and Mathematics, the subject-level figures offer a more detailed picture of achievement across the Junior Cycle examinations.
The national picture: How did students perform?
Across all subjects, Distinctions accounted for 8.6% of grades, unchanged from 2025. Higher Merits represented 30.2%, compared with 30.4% the previous year.
These figures suggest that the proportions of the two highest grade categories remained broadly stable between the two years.
However, year-on-year comparisons need to be considered in the context of changes to the Junior Cycle grading system.
How did students perform across individual subjects?
The subject-level figures reveal some notable differences in the proportion of candidates achieving Distinctions.
Italian recorded the highest Distinction rate, at 15.7%. However, this result came from a small cohort of 529 candidates.
Classics also recorded a high proportion of Distinctions, at 14.5%, followed by Music at 12.7%.
At the other end of the scale, English Higher Level recorded a Distinction rate of 4.1%, the lowest among the examination entries shown in the subject-results table.
History recorded a Distinction rate of 9.1% among its 72,019 candidates, while Mathematics Higher Level recorded 9.3%.
The proportions achieving particular grades vary considerably between subjects, as do the numbers of candidates taking each examination.
Candidate numbers are particularly important when interpreting results in smaller subjects. A relatively small change in the number of candidates achieving a particular grade can have a more noticeable effect on the overall percentage.
Higher Merits: Which subjects recorded the highest proportions?
Distinctions often attract the most attention, but the Higher Merit category provides another useful perspective on the results.
Home Economics recorded the highest proportion of Higher Merits, at 45.8%. Wood Technology followed at 41.0%, while Engineering recorded 37.3%.
English Higher Level, by comparison, had 23.7% of candidates achieving a Higher Merit.
Combining Distinctions and Higher Merits provides a broader indication of the proportion of candidates achieving one of the two highest grade categories.
Classics recorded a combined figure of 50.1%, while Music recorded 48.4%.
Several practical subjects also showed strong representation in these two categories. Home Economics recorded a combined Distinction and Higher Merit rate of 55.5%, while Wood Technology recorded 50.4%.
These figures illustrate the different grade distributions across subjects. However, they should not be interpreted as direct measures of relative subject difficulty or teaching quality. Candidate numbers, subject participation and the nature of individual examinations all need to be considered.

What do the 2026 results tell us?
There are several observations worth taking from this year’s figures.
- National Distinction rates remained unchanged
The proportion of grades awarded a Distinction was 8.6%, the same as in 2025. Higher Merits decreased slightly, from 30.4% to 30.2%.
- Subject-level results vary considerably
Italian, Classics and Music recorded some of the highest Distinction proportions, while English Higher Level recorded the lowest among the entries shown in the results table.
- Higher Merits reveal additional patterns
Home Economics, Wood Technology and Engineering recorded particularly high proportions of Higher Merits. Considering Distinctions and Higher Merits together provides a more complete picture of achievement at the upper end of the grading scale.
- The full grade distribution matters
French demonstrates why it is important to look beyond the highest grades. Changes in Distinctions, Achieved, Partially Achieved and No Grade provide different perspectives on the results, as all increased year-on-year.
- Comparisons with previous years require context
The revised Junior Cycle grade bands introduced in 2025 mean that comparisons with earlier examination years need to be approached carefully. The way those revised bands were implemented also differed between 2025 and 2026.
Ultimately, examination results provide useful information about student achievement, but they do not tell the whole story.
Interested in more detailed examination data?
National examination statistics provide an important benchmark, but schools may also want to understand how their own students performed in individual subjects compared with national results and previous years.
Athena Analytics provides individual school reports featuring subject-level examination results, national comparisons and historical performance data.